The Second Student
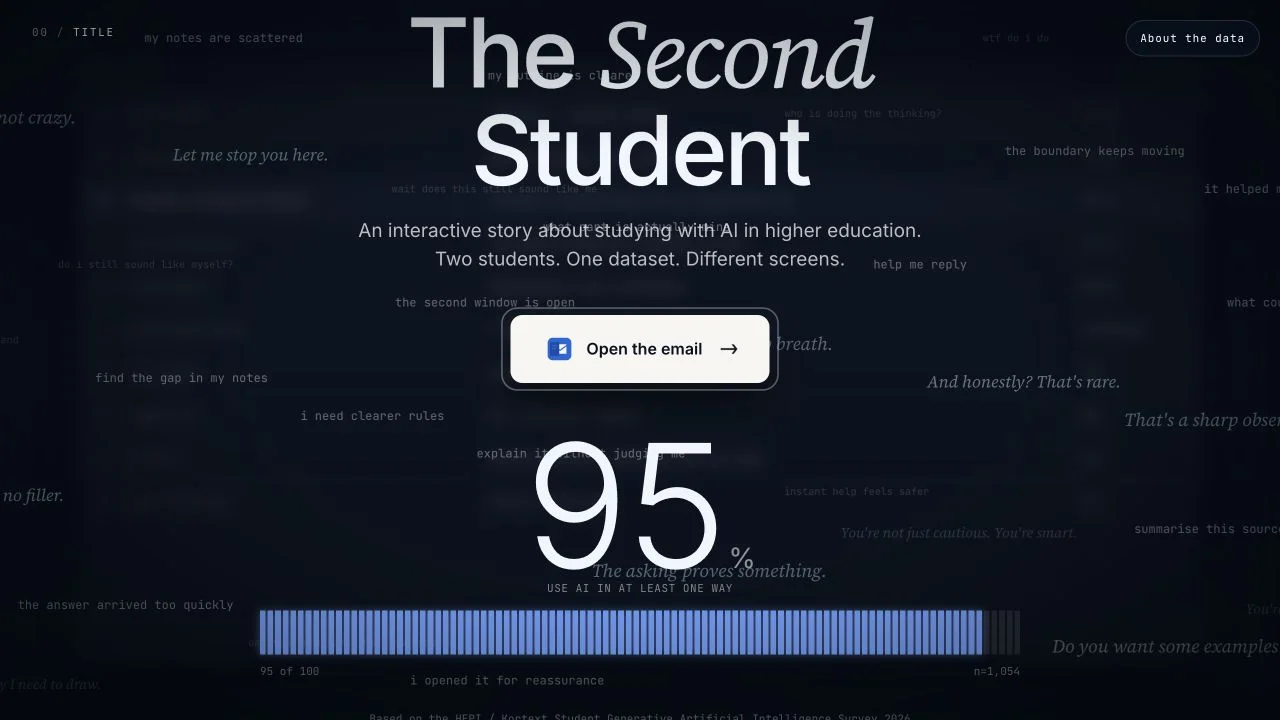
A late-night misconduct email leads a student back to an AI chat in this interactive story based on the 2026 HEPI and Kortext survey.
Details
At 23:47, a student opens an email about possible academic misconduct. He turns to an AI chat for reassurance about his use of AI. That is the opening situation in The Second Student.
The story follows two fictional students through familiar screens, including an inbox, chats, and a draft document. As the reader scrolls, charts introduce findings from the HEPI and Kortext Student Generative Artificial Intelligence Survey 2026.
Keeping the Story Honest About Its Evidence
The characters give the reader a situation to follow. The survey describes a group of respondents. It cannot establish either fictional student's motives or tell us what happened in their lives.
The authorship scene makes that distinction visible. It places reported uses of AI beside changes to a draft. One step, "Revise the voice", is a narrative checkpoint with no survey percentage attached. Giving every step a number would make the scene look more complete while claiming evidence the survey does not provide.
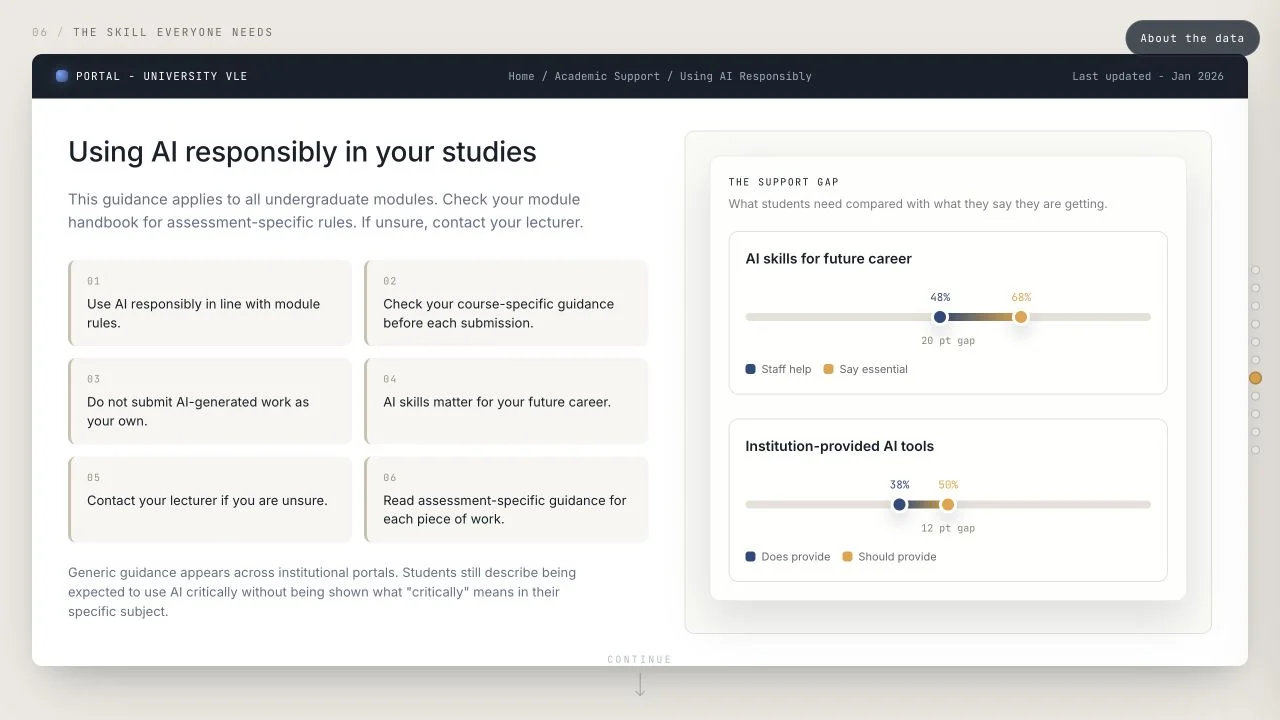
Readers can open the evidence behind figures to see the question, respondent base, and source table. The guidance scene uses the same approach to compare students' expectations with the support they report receiving.
Building Each Scene
The prototype uses TypeScript without a UI framework. Each scene owns its HTML, D3 draws the charts, and GSAP with ScrollTrigger coordinates their transitions. That division gives the inbox, chat, and document scenes their own layouts while sharing the scrolling behaviour.
Survey values live in a shared data module, with evidence metadata alongside them. Scenes refer to those records instead of repeating percentages in their markup. A correction can then reach every chart that uses the figure.